Clean Mobility Options Needs Assessment Data Collection Guide, California, 2020
5 minutes Date Launched: Jan 1, 2020 Dates given are approximate.

Summary
The Clean Mobility Options Needs Assessment Data Collection Guide offers data sources and indicators for accessibility, reliability, and affordability, three characteristics for determining mobility patterns of specific regions to create a baseline in the needs assessment stage of a project. It also provides step by step instructions on how to use many of the tools listed below.
Data Sources for: Measuring walkability, distance to transportation options from origin points, accessibility to jobs relative to where people live, and cost of transportation:
- EPA National Walkability Index: The EPA National Walkability Index is a nationwide geographic data resource that ranks census block groups according to their relative walkability.
- AllTransit:
- Walkable Neighborhoods lists the average amount of time it takes to walk around a block that is within ½ mile of transit. This information can be found in the health tab and used to show how long it takes for people to access local transportation options.
- Measures distance to shared mobility options. This information can be found in the mobility tab.
- Measures access to job opportunities by transit, walking or biking. This information can be found in the Jobs tab. Determines how feasible it is for people to commute to work using a bicycle. This information can be found in the Health tab. Shows the bikeshare locations near transit. This information can be found in the Mobility tab.
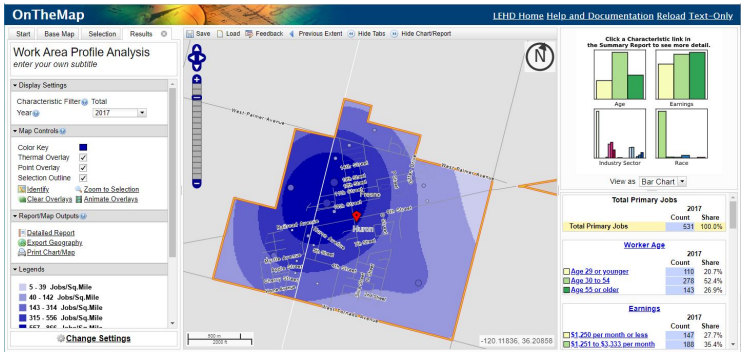
- Longitudinal Employer-Household Dynamics Origin-Destination Employment Statistics (LEHD-LODE): This dataset provides information on how many jobs are in a specific area. It also shows how many people commute in and out of a specified area for employment.
- Local Metropolitan Planning Organizations (MPOs) or Councils of Government (COGs): These entities may have more locally focused indicators, such as street pavement or sidewalk quality data. MPOs or COGs can be found when searching an address in AllTransit or H & T.
- EPA Smart Location Database Mapping Tool: Summarizes characteristics such as housing density, diversity of land use, neighborhood design, destination accessibility, transit service, employment, and demographics.
- Google Maps: Determines distance (in miles) between transit stops and a particular origin point.
- AAA Gas Cost Calculator: This indicator calculates the average cost per week for fueling a vehicle. Users visit the website and follow the prompts on the site.
- US Census Data: Access economic and demographic data at a neighborhood (Census blocks) or aggregated to city, county or metropolitan area.
- H&T Index:
- This tool measures different costs of transportation including annual transportation costs, annual auto ownership cost, annual vehicle-miles travelled (VMT) cost, and annual transit costs by Census block or tract level. Users select the appropriate indicator from the dropdown menu once they enter the project area and the tool calculates the appropriate costs.
- Can measure the percent of income spent on transportation and housing, or transportation relative to other household expenditures like healthcare or food. Users select from the appropriate indicator from the drop-down menu once they enter the project area into the address lookup area. Areas where people spend more than 35% of their income on housing and transportation costs are typically considered burdened; areas with housing expenditures greater than 30% are typically considered burdened; and areas with transportation costs greater than 15% of income are typically considered burdened.
Other means of creating a baseline profile for questions like, accessibility of smartphones or bank accounts or perceived reliability of transit within the region or community, is through community engagement efforts such as surveys, community forums, one-one-one conversations and on-the-ground observation and inventory.