The Lynden Hop’s Legacy: Lessons Learned From Operating Microtransit In-House
25 minutes Author: Shared-Use Mobility Center Date Launched/Enacted: Dec 8, 2025 Date Published: December 8, 2025
Summary
- The Lynden Hop was a three-year microtransit pilot launched by the Whatcom Transportation Authority to address mobility challenges in the small city of Lynden, Washington. Funded primarily by the Federal Transit Administration’s Integrated Mobility Innovation program, the Lynden Hop offered curb-to-curb, on-demand service beginning in March 2020.
- Whatcom Transportation Authority opted to operate the Lynden Hop entirely in-house, allowing the agency direct control over service and trip-level data. This distinguishes this project from many other microtransit pilots that use turnkey vendors to handle most service operations.
- Operating the service in-house gave WTA more control over staffing and scheduling, allowing operators greater flexibility in choosing shifts and opportunities to work on either fixed-route or on-demand service. This approach allowed the agency to directly shape service quality and workforce experience, in contrast with a turnkey model, where such choices are often limited.
- The Lynden community’s response to the Lynden Hop was overwhelmingly positive, with riders finding the service a reliable and affordable way to access essential services and activities.
- Although the Lynden Hop concluded in June 2024 due to financial constraints, the insights gained during the pilot period directly shaped a redesigned fixed bus route. The pilot’s legacy lies in demonstrating on-demand service as a flexible solution while highlighting the tradeoffs between scalability, convenience, and program sustainability.
![]()
This project is part of the Mobility Innovation Collaborative (MIC). The MIC provides a comprehensive suite of technical assistance resources, promotes knowledge sharing activities, and captures stories and lessons learned from innovative mobility projects across the United States.
Originally published December 2025.
Video description: Mary Anderson and Audra Stiles of Whatcom Transportation Authority discuss the Lynden Hop Program, a microtransit service uniquely operated-house. Credit: Shared-Use Mobility Center (SUMC)
Introduction
The City of Lynden is a small community in Whatcom County, Washington, with an approximate population of 17,000. Because of its population size and proximity to the larger city of Bellingham, the Lynden community faced many mobility challenges: limited and infrequent fixed-route transit, with destinations dispersed across a large geographic area. Due to this geographic disbursement, residents without access to personal vehicles have faced obstacles in accessing grocery stores, medical appointments, and social activities on short notice, especially when these activities fall outside of the fixed-route corridor.
To help fill the mobility gap that often coincides with more geographically dispersed places, Lynden’s local transit authority, Whatcom Transportation Authority (WTA), created a curb-to-curb microtransit pilot called the Lynden Hop. The Lynden Hop was widely embraced by both existing riders of WTA service and riders new to public transportation. The microtransit service offered more flexibility for passengers to reach destinations without timing their schedules around the fixed-route bus or relying on rideshare or friends and family to drive them to their destination.
Since beginning service in March of 2020, the Lynden Hop has experienced a handful of positive community impacts, some of which can be attributed to its in-house operations. Operating a microtransit service in-house allowed WTA to maintain control over its program outcomes and quickly tailor service to adapt to the needs of riders and operators. As of June of 2024, the Lynden Hop is no longer active; however, improvements to Lynden’s fixed route bus have been tailored to accommodate some of the lessons learned from the Lynden Hop pilot.
This case study explores the lessons learned from the Lynden Hop project and WTA’s experience running an in-house microtransit service, highlighting the strengths of in-house planning, service, and community engagement, as well as discussing how the lessons learned from the on-demand Lynden Hop pilot informed the revised route of the 26 bus and the study of microtransit deployments in other areas of Whatcom County.
Service Planning
Just before the start of the COVID-19 pandemic, a WTA Board member raised an important question: Could on-demand microtransit provide a more flexible option to address service gaps in Whatcom’s smaller communities, particularly in places like Lynden? This suggestion resonated with WTA’s leadership interest, as the agency had long grappled with the challenge of providing compatible service specifically in Lynden through its fixed-route bus, Route 26.
As a whole, WTA’s fixed-route system is structured to balance the needs of both Bellingham and the smaller communities spread across Whatcom County. The network ensures that outlying towns have access to public transportation, though this often comes at the expense of frequency and lengthy headways. Narrowing in, WTA’s Route 26 travels in a loop pattern through downtown, then goes southbound to connect to Bellingham. With headways of 60 minutes and a service area that was constrained to a single corridor, Route 26 has been a challenge for riders who relied on transit for daily needs such as shopping, appointments, or community activities within Lynden itself. For many residents, especially those without access to a car, this left gaps in their ability to independently reach essential destinations in town or travel conveniently outside of Lynden.

A map of the Lynden Hop pilot service area and Route 26. Credit: Whatcom Transportation Authority. Credit: Whatcom Transportation Authority
Routes like the 26 illustrate a tradeoff inherent in traditional fixed-route service in more dispersed locations: while they can provide essential connections within their corridors, they operate on headways that are typical of the wider system rather than offering high-frequency service. WTA’s countywide network reflects the realities of serving a geographically large and dispersed area, where the goal is less about rapid service in a single corridor and more about ensuring mobility options exist throughout the region. The Lynden Hop pilot thus served as both a local circulator within Lynden and a link to regional connections, providing riders with flexibility that was previously unavailable.
Credit: Whatcom Transportation Authority
Building on the concept of demand-responsive service, WTA applied for funding through the Federal Transit Administration’s (FTA) Integrated Mobility Innovation (IMI) program. In March of 2019, WTA was awarded $719,388 in IMI funding, which enabled the planning and launch of the Lynden Hop pilot. Drawing inspiration from peer agencies, WTA embarked on a demonstration project to test on-demand services and technologies in coordination with existing transit service. But WTA stood out from its peers as it explored the possibilities of planning, managing, and operating a microtransit service fully in-house.
WTA developed an in-house microtransit service aiming to achieve cost-efficient on-demand trips comparable to its paratransit service ($65.70 per trip for the Hop versus $86.95 per trip for paratransit) while retaining operational control. The pilot also provided an opportunity to test how a public agency could manage a microtransit service fully in-house, maintaining a high quality service and direct access to trip-level data.
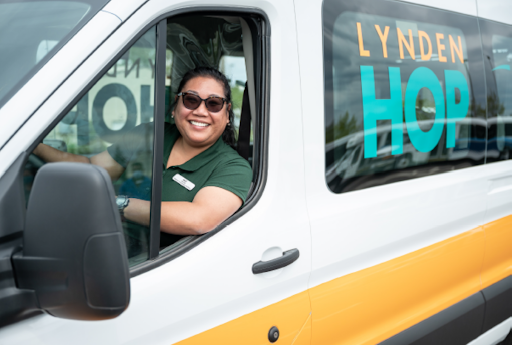
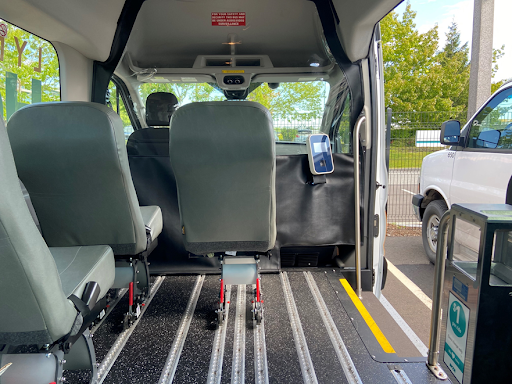
Aiming to serve the largest number of riders possible in the service area with the minimum wait and travel time possible, WTA purchased two Ford Transit vans exclusively dedicated to the Hop service, WTA retrofitted both vans to include high ceilings, a wheelchair lift, and smart floors (floors that allow for more modular seating) to make boarding easier for passengers with mobility challenges. Van retrofits also included a farebox where passengers could pay with cash or via the Hop mobile app, with fares at a set price of $1 per trip.
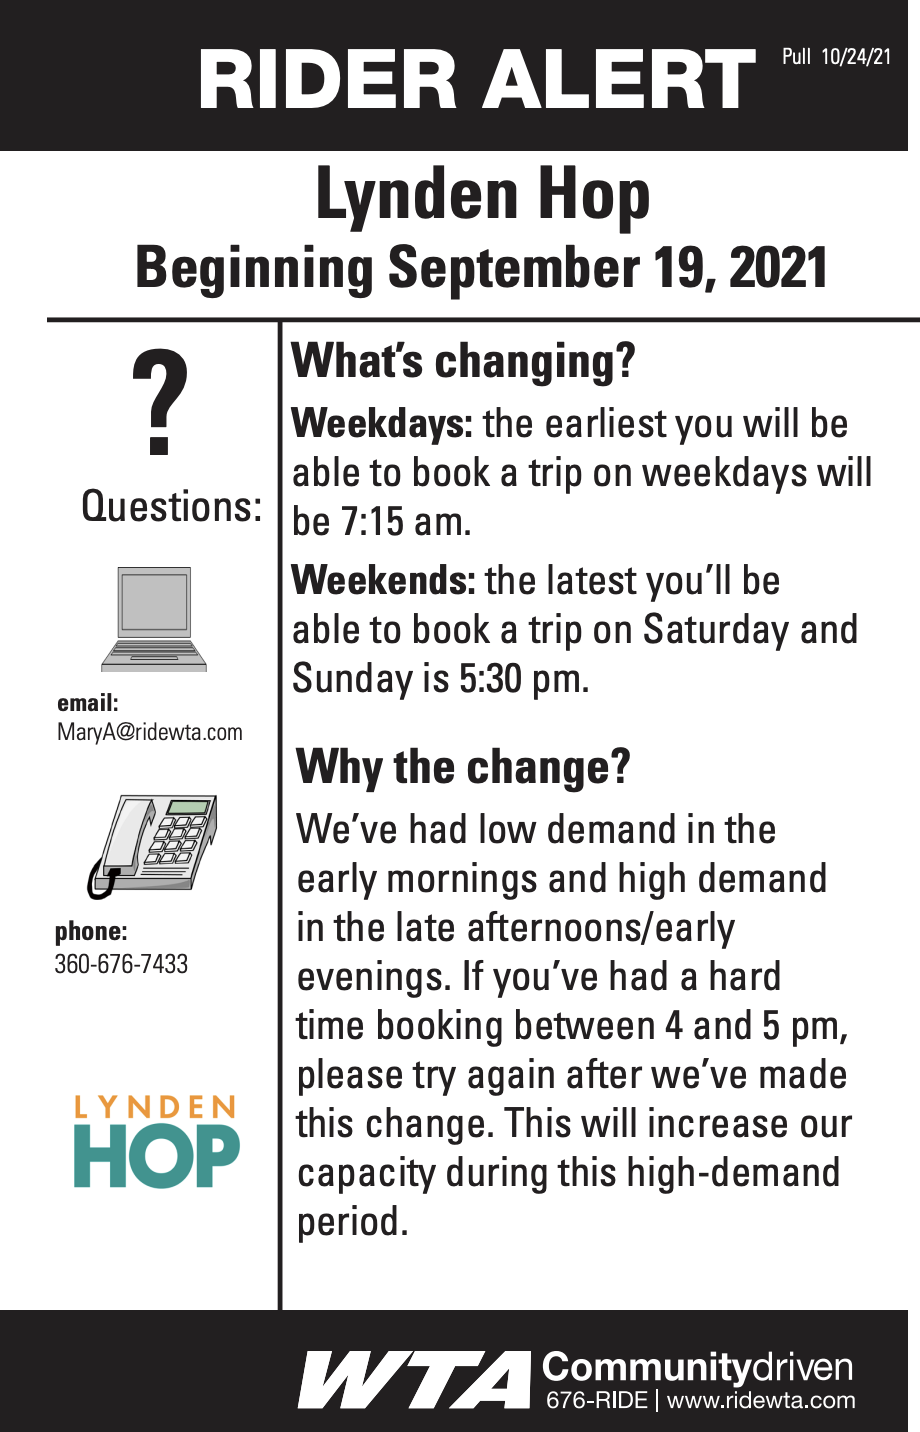
Rider Alert Flyer notifying about service changes. Credit: WTA
Mindful of the demographic diversity of its community, To reach as many people as possible, WTA prioritized providing having a multilingual service and resources when promoting and operating the Hop to reach as many people as possible. Service materials, including guides and instructions for requesting trips, were made available in Spanish as well as English to ensure clarity and ease of service for Spanish speakers. In addition, multilingual assistance through LanguageLine, a national service that assists with interpretation for over 380 languages, was provided to assist non-native English speakers with accessing the service, booking rides, and understanding routes.
After the months-long planning and procurement process, the Lynden Hop pilot officially launched on March 15, 2020, coinciding almost exactly with the onset of the COVID-19 pandemic. This timing created an unexpected challenge for WTA: testing an entirely new service model in the midst of public health restrictions and changing travel patterns. Traditional fixed-route ridership declined globally during the COVID-19 pandemic due to travel restrictions and work-from-home orders;, however, access to safe ways to obtain groceries, healthcare, and other essential services remained critical. In Lynden specifically, the Lynden Hop’s in-house model positioned WTA to experiment in real time with how the new service could adapt to travel restrictions safely.
WTA decided to operate the Lynden Hop in-house instead of contracting a private operator or a turnkey vendor. Typically, turnkey operators provide a software platform and handle day-to-day operations, instead of requiring the partner agency to maintain these services. By contrast, WTA’s IMI proposal was unusual in seeking to keep operations fully within the public agency, ultimately giving WTA control over service quality and data management, and allowing the agency to quickly adapt to service changes. From an operational perspective, this gave WTA the ability to monitor outcomes through data collected in-house and immediately adapt service to passenger needs without putting strain on a private operator or turnkey vendor. Staff experience reinforced the advantages of this approach; operating the Lynden Hop internally meant that WTA had full access to trip-level data, including origins, destinations, and repeat ridership patterns, many insights that agencies often struggle to obtain from third-party vendors. In addition, WTA deployed existing transit operators to staff the Lynden Hop vehicles, ensuring that riders received the same level of service that riders experience on the fixed-route service.
Trip purposes
Like many small communities, Lynden faces mobility challenges in terms of access to transportation options. In 2023, a reported 6.4% of Whatcom County Residents did not have access to a personal vehicle, making daily travel more difficult to do independently. These challenges are especially pronounced for Lynden’s aging population; more than 18.3% of Lynden residents are over 65. To best understand their passenger base and how passengers were using the service, Lynden Hop conducted their own survey in May 2023. Surveys were distributed in the two Hop vans in paper form and via an online link included in a rider alert through the app and WTA’s website. That month, 163 unique passengers rode the Lynden Hop, meaning the survey captured feedback from approximately 31% of all riders.
Survey responses provided insight into usage patterns. Most riders reported using the Hop one to two days per week (29%), followed by occasional riders (25%) and those riding three to four days per week (24%). Smaller shares used the service less than once per week (8%), four to five days per week (8%), or five to seven days per week (6%). The most common trip purposes were shopping (30%) and work or volunteering (22%), aligning with origin-destination mapping data that shows grocery stores as the most frequent destination. Ultimately, the Lynden Hop helped fill a critical mobility gap – nearly half (45%) of users would have asked someone else for a ride if the service was not available. In addition, one in four (25%) of the survey respondents said they would have stayed home altogether, demonstrating how impactful the Lynden Hop was in helping independent living (statistics from WTA’s IMI Final Report).
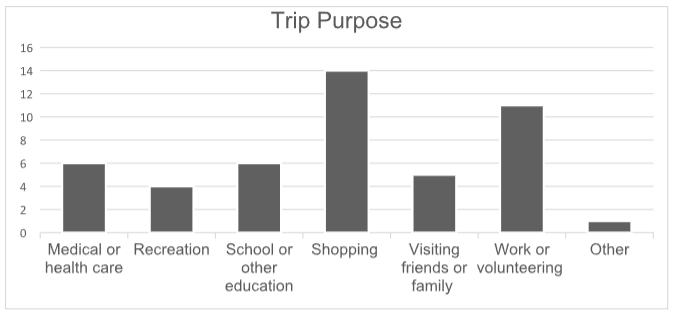
Credit: Whatcom Transportation Authority Lynden Hop Ridership Survey, highlighted in WTA’s IMI Final Report
The rider survey also took into account where riders were traveling to and from. Grocery shopping emerged as the single most common trip type (reported 30% based on ridership data), with the Safeway shopping center as a frequent destination. This insight reflects how access to food and household goods is limited for residents who lack reliable transportation, especially older adults who might otherwise depend on others to get to and from grocery stores. Beyond shopping trips, other uses included medical appointments, social outings, and after-school travel for students. For some parents, the Lynden Hop provided support by transporting children home from sports practices and activities when school bus service was unavailable, relieving them of needing to leave work early. For seniors and older adults, the on-demand nature of the service proved equally transformative by offering the ability to be flexible and schedule a ride on short notice, providing a pathway to independence they did not have access to previously.
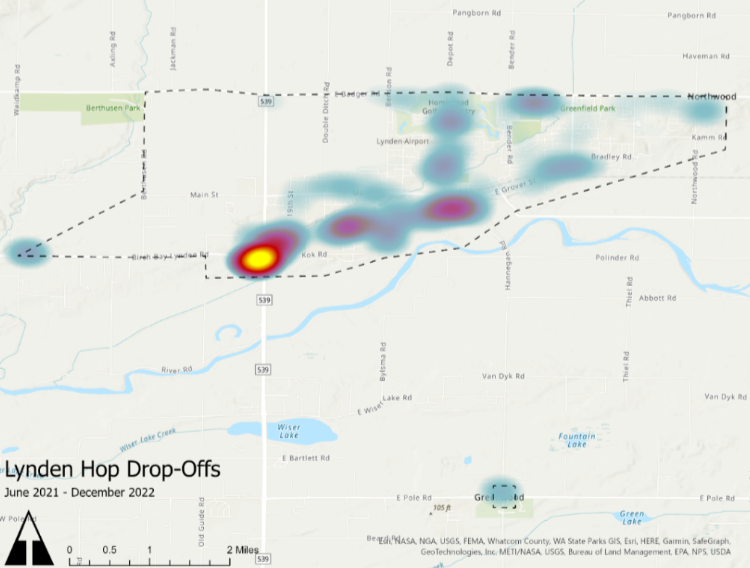
Lynden Hop Drop-Off Heat Map. The hottest drop off and pickup zone was at the Safeway (grocery store). Credit: Whatcom Transportation Authority IMI Final Report.
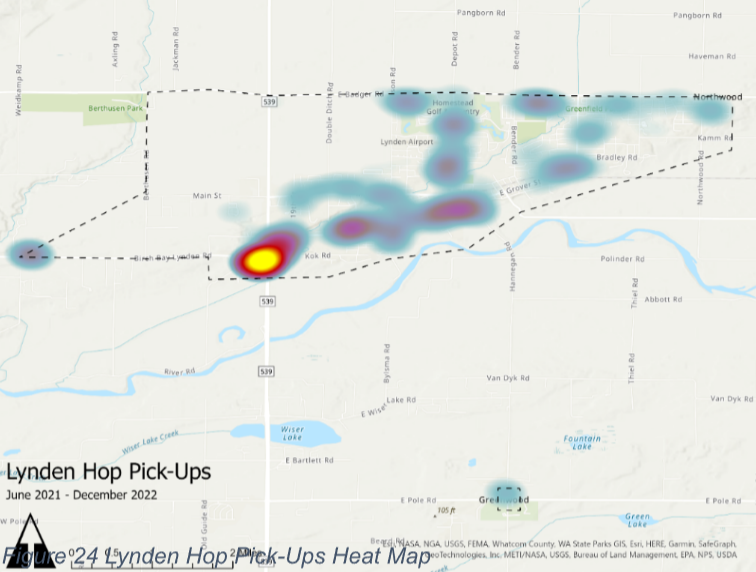
Lynden Hop Pick-Up Heat Map. The hottest drop-off and pickup zone was at the Safeway (grocery store). Credit: Whatcom Transportation Authority IMI Final Report.
Overall, the Lynden Hop pilot had a measurable impact on mobility in Lynden by addressing gaps that fixed-route transit could not as easily fill. While the Lynden Hop pilot was not designed primarily as a first- and last-mile connector, WTA initially anticipated that the service might support transfers to the fixed-route network at the Lynden Transit Station. In practice, this goal was not realized at scale. The vast majority of trips remained local, serving needs within the city limits of Lynden rather than connecting passengers to Bellingham or other destinations. Despite this, the Lynden Hop service improved local connectivity across the city, demonstrating that passengers valued the Lynden Hop the most as a tool for everyday, intra-city transportation. Throughout the sunset phase of the Lynden Hop, trip purposes were considered and eventually added to the fixed-route 26 bus.
Microtransit Pilot Informed Fixed-Route Planning

Timeline for the June 2024 WTA Service Changes. Credit: Whatcom Transportation Authority
By mid-2024, the Lynden Hop had a large passenger base and community demand, but also revealed the operational limits of sustaining microtransit in a city of Lynden’s size. Financial reports revealed that in Whatcom County, Lynden was receiving a disproportionately high level of transit investment. When looking at the combined costs of operating Route 26 in addition to the Lynden Hop, the service hours allocated to Lynden were doubled compared to Ferndale (a neighboring city with a nearly identical population size). In budgeting terms, WTA was investing approximately $2.2 million annually in transportation for Lynden, compared to $1.2 million for Ferndale. Given that WTA’s largest funding source is countywide sales tax, this imbalance raised questions of fair distribution of funding and fiscal sustainability.
Operationally, the Lynden Hop also faced limitations in terms of daily usage. Unlike fixed-route buses, where productivity is measured by the number of passengers per hour, microtransit models in small towns rarely exceed one to two rides per hour on average. To compare costs with paratransit, however, microtransit is typically measured in cost per ride rather than passengers per hour. On that basis, the Lynden Hop’s cost per ride remained lower than paratransit ($63.80 versus $86.95 per ride), but the economics were still challenging for the long-term sustainability of the program. These realities led WTA to conclude that, while the pilot successfully tested feasibility in Lynden, it could not be replicated at scale across Whatcom County.
When the decision was made to conclude the Lynden Hop pilot, WTA worked to include lessons from the microtransit service into the redesign of Route 26. Data from the Lynden Hop operations as well as public feedback from surveys and public hearings showed that trips to and from shopping centers were by far the most common purpose of travel, to which WTA responded by redesigning the route to include a stop directly serving the Safeway shopping center, as well as installing a new bus shelter to improve passenger comfort.
Additionally, paratransit remained available to eligible riders, absorbing some of the demand previously served by the Lynden Hop. The pilot had a notable effect on paratransit ridership as well; after the Lynden Hop ended, paratransit trips in Lynden increased, likely due to familiarity with the service structure. Additionally, paratransit remained available to eligible riders, absorbing some of the demand previously served by the Lynden Hop. The pilot had a notable effect on paratransit ridership as well; after the Lynden Hop ended, paratransit trips in Lynden increased, likely due to familiarity with the service structure.
The community’s response to the service ending was mixed; many residents expressed their disappointment at the loss of the Lynden Hop’s convenience and flexibility, particularly seniors and families who found the value in using the service to become more independent. However, WTA engaged community members through open houses, surveys, flyers, and its Engage WTA platform to ensure that passengers knew why the service was coming to an end, and emphasized that the Lynden Hop had always been a grant-funded pilot. Ultimately, the transition from the Lynden Hop to a revised Route 26 helped shape long-term planning and provided WTA with critical insights into travel patterns and rider preferences.
Community Impacts

Source: Lynden Tribune
The Lynden Hop pilot had two main objectives: to evaluate whether WTA could operate an on-demand program internally while maintaining financial sustainability, and to measure the effectiveness of a microtransit pilot in a small city like Lynden. The community’s response to the Lynden Hop was overwhelmingly positive, as riders described the service as reliable and affordable in meeting their day-to-day needs; WTA reports that 94% of riders were picked up within 15 minutes of their requested time. The Lynden Hop gained traction steadily after its launch, with ridership peaking at nearly 60 trips per day, which is the maximum number that WTA could accommodate without straining service. Trips were an average of three miles, and roughly a total of eleven minutes.
Driver Impacts
WTA’s operators were enthusiastic about the Lynden Hop, with Lynden Hop shifts quickly becoming the most sought-after assignments. Drivers appreciated several aspects of the work, including smaller vehicles, a consistent passenger base, and the opportunity to build relationships with regular riders. The daytime schedule was also a positive change from the split shifts and later hours typically associated with fixed-route service. Feedback received from drivers worked to inform operational improvements and contributed to other planning decisions. Insights gathered from operators helped WTA adjust Route 26 to better align with demonstrated passenger demand.
While the Lynden Hop was operating, SUMC interviewed a Lynden Hop driver to learn their perspective of driving for fixed route operations compared to microtransit operations. This driver noted that the Lynden Hop service was all-around a great service for both the driver as well as the passenger. The driver also noted that microtransit services help the driver build a closer relationship with passengers, ultimately making the service feel more community-centric and impactful.
Funding
The Lynden Hop was primarily supported through FTA’s IMI program. This competitive program was specifically designed to allow transit agencies to design and test new transit solutions, such as microtransit or other on-demand services. For WTA, the IMI award provided the initial financial foundation to experiment with a new model of service that would not have been feasible under a typical operating budget, especially as the COVID-19 pandemic was causing ridership to plummet worldwide. IMI support allowed for WTA to procure start-up capital, including vehicles and technology, as well as the operating subsidy required to sustain a multi-year pilot.
| 2022 | Fixed Route | Paratransit | Zone | Vanpool | Hop |
|---|---|---|---|---|---|
| Boardings | 2,913,033 | 154,428 | 1,419 | 19,991 | 13,109 |
| Revenue Hours | 157,245 | 63,062 | 642 | 2,145 | 5,484 |
| Revenue Miles | 2,133,859 | 799,266 | 15,838 | 115,097 | 56,942 |
| Passenger Miles | 8,485,521 | 764,763 | 21,827 | 682,081 | 40,169 |
| Boardings per Hour | 18.5 | 2.4 | 2.2 | 9.3 | 2.4 |
| Passenger Miles per Hour | 53.9 | 12.1 | 34.0 | 318.0 | 7.3 |
| Passenger Miles per Boarding | 2.9 | 5.0 | 15.4 | 34.1 | 3.1 |
Table demonstrating the cost per trip by mode type. Credit: Whatcom Transportation Authority Lynden Hop Ridership Survey, highlighted in WTA’s IMI Final Report
While the IMI award covered much of the pilot’s operational and capital costs, WTA also utilized funds matched from its local budget. Most notably, by operating and planning a microtransit service in-house, WTA leveraged existing staff capacity to absorb the costs of labor for additional cost savings. WTA utilized in-house mechanics, dispatchers, customer service representatives, vehicle drivers, and administrative staff to support the Lynden Hop service. This in-house approach meant that staff time, training, and system training were funded by WTA’s operations budget, effectively layering federal contributions on top of local resources. Additionally, WTA’s largest local revenue source was a county-wide sales tax, and it remained the backbone of the budget throughout the Lynden Hop pilot. Still, it could not cover the entire cost of the service.
Technical Assistance
One of the distinguishing features of the IMI program was its emphasis on capacity building for transit agencies’ staff to accelerate mobility innovation. WTA participated in peer-to-peer monthly cohort meetings convened by the Shared-Use Mobility Center (SUMC) that allowed IMI and AIM awardees to exchange experiences and troubleshoot common challenges. For WTA, these meetings provided both a forum for discussing practical solutions and an opportunity to learn about the challenges other agencies were experiencing in piloting similar on-dremand services.
Beyond peer learning, WTA worked with the IMI program’s Independent Evaluation team, led by the University of California, Los Angeles (UCLA) and ICF International, to conduct the project’s data collection and evaluation. The IMI Independent Evaluation team traveled to Lynden to conduct rider surveys, facilitate community listening sessions, and ride along on Lynden Hop vehicles to observe service in real time. This external evaluation process strengthened WTA’s ability to document outcomes.
Lessons Learned and Capacity Building
In-house microtransit operations
The Lynden Hop pilot demonstrated clear advantages to WTA’s decision to operate the service fully in-house. By staffing the Lynden Hop with WTA operators and managing bookings, dispatch, and customer service internally, the agency maintained direct control over service quality. This not only ensured consistency in reliability but also allowed the agency to quickly troubleshoot operational challenges as they emerged. Riders benefited from working with familiar drivers and customer service representatives, helping to build trust in the service. For a small-town community like Lynden, where relationships and familiarity are central to rider confidence, this continuity proved especially important for onboarding new users to a microtransit model.
From an institutional standpoint, the pilot reinforced the value of a transit agency in retaining control over data and technology. Some peer agencies struggled to extract trip-level information from private vendors due to contractual obligations or concerns over intellectual property. The major upside of in-house operations is that WTA had immediate access to origin-destination patterns, repeat ridership, and trip purposes. This provided planners with a clear window to the transit needs of the area, and ultimately made it easier for WTA to make data-driven service adjustments. At the same time, small transit agencies like WTA face inherent challenges with in-house data analysis as dedicated data analysis staff are often unavailable, and responsibility may fall to staff performing multiple roles, or due to the lack of advanced data analysis tools. Despite these constraints, WTA was able to extract actionable insights from the Lynden Hop data, demonstrating that even modest in-house capacity can provide meaningful guidance for service adjustments and strategic planning. The major outcome of this data-driven approach included learning more about riders’ mobility needs which resulted in the eventual restructuring of Route 26 to better meet the needs of the passengers. Further, readily available data also had direct operational impacts. With access to trip patterns, WTA staff were able to make immediate adjustments to the service if needed. In effect, the Lynden Hop functioned not only as a mobility service but also as a real-time data gathering tool.
Operating in-house also created opportunities for workforce development and internal learning. WTA staff gained first-hand experience with demand-response scheduling and customer service approaches, skills that are less common with traditional fixed-route operations. This institutional knowledge can help inform future on-demand services that WTA may incorporate. Drivers themselves also provided valuable feedback during the pilot, offering perspectives on route efficiency and rider interactions that could help inform service adjustments.
Influence on WTA’s Approach to Future Services
While the Lynden Hop service concluded in June of 2024, its influence on WTA’s service planning continues to be significant. The pilot provided a real-world example for understanding the operational requirements of running microtransit in-house, revealing both its strengths and limitations. Among some of the key insights was that scaling a permanent on-demand program would require additional agency capacity, particularly additional dispatch, IT, and customer service support. These functions would demand a greater investment if microtransit were to become a long-term service mode within WTA’s portfolio.
After the Lynden Hop had concluded its service run, WTA worked with Transpo Group to conduct a feasibility study to consider additional microtransit services in different areas and service environments across the region. This analysis explored where and when microtransit service could be a viable transportation solution forWhatcom County’s communities‘. In the study, potential areas for microtransit service were determined and ranked among six different metrics to find the best-suited area:
1. New Zone Cost
2. Existing Fixed-Route and ADA Service
3. New Transit Rides for Priority Populations
4. Reduction in Vehicle Miles Traveled
5. Connection to Existing Routes
6. Cost per Boarding
Based on these metrics, Lynden was ranked as the third most feasible area in Whatcom County for a microtransit pilot, behind Ferndale and Blaine/Birch Bay. The study concluded that while microtransit can provide a flexible, appealing service to riders, it comes at a significant cost to WTA. To adequately implement a new microtransit service, WTA would need to establish a new program to address the staffing and programmatic needs of the service. In addition to the nearly $2 million annually needed to operate an additional microtransit service in Lynden, the estimated cost to cover these programmatic needs would be about $550,000. For all potential microtransit zones analyzed in the feasibility study, evaluators found that it “would cost significantly more to provide microtransit service than it costs to provide fixed route services, even considering savings from removing fixed route services from the zones.” Ultimately, because of these significant costs, the WTA Board decided not to pursue any additional microtransit projects.
However, the feasibility study did note the value of WTA operating microtransit in-house. The study notes that “Given WTA’s experience operating the Lynden Hop and other efficiency and performance benefits of in-house operations, this study recommends that WTA consider in-house operations of future microtransit services.”
The Lynden Hop also made the trade-offs between fixed route and microtransit service clearer; microtransit can provide convenience and independence, but can also be difficult to scale across multiple cities, especially given WTA’s countywide funding structure. This trade-off between convenience and scalability ultimately shaped WTA’s strategic decision-making; carefully analyzing trip data and rider feedback helped the agency determine that many of the trip purposes could be served through a revised Route 26. In this way, the Lynden Hop left a lasting legacy, despite the service being temporary. WTA learned more about rider behavior and clarified the monetary requirements of microtransit.
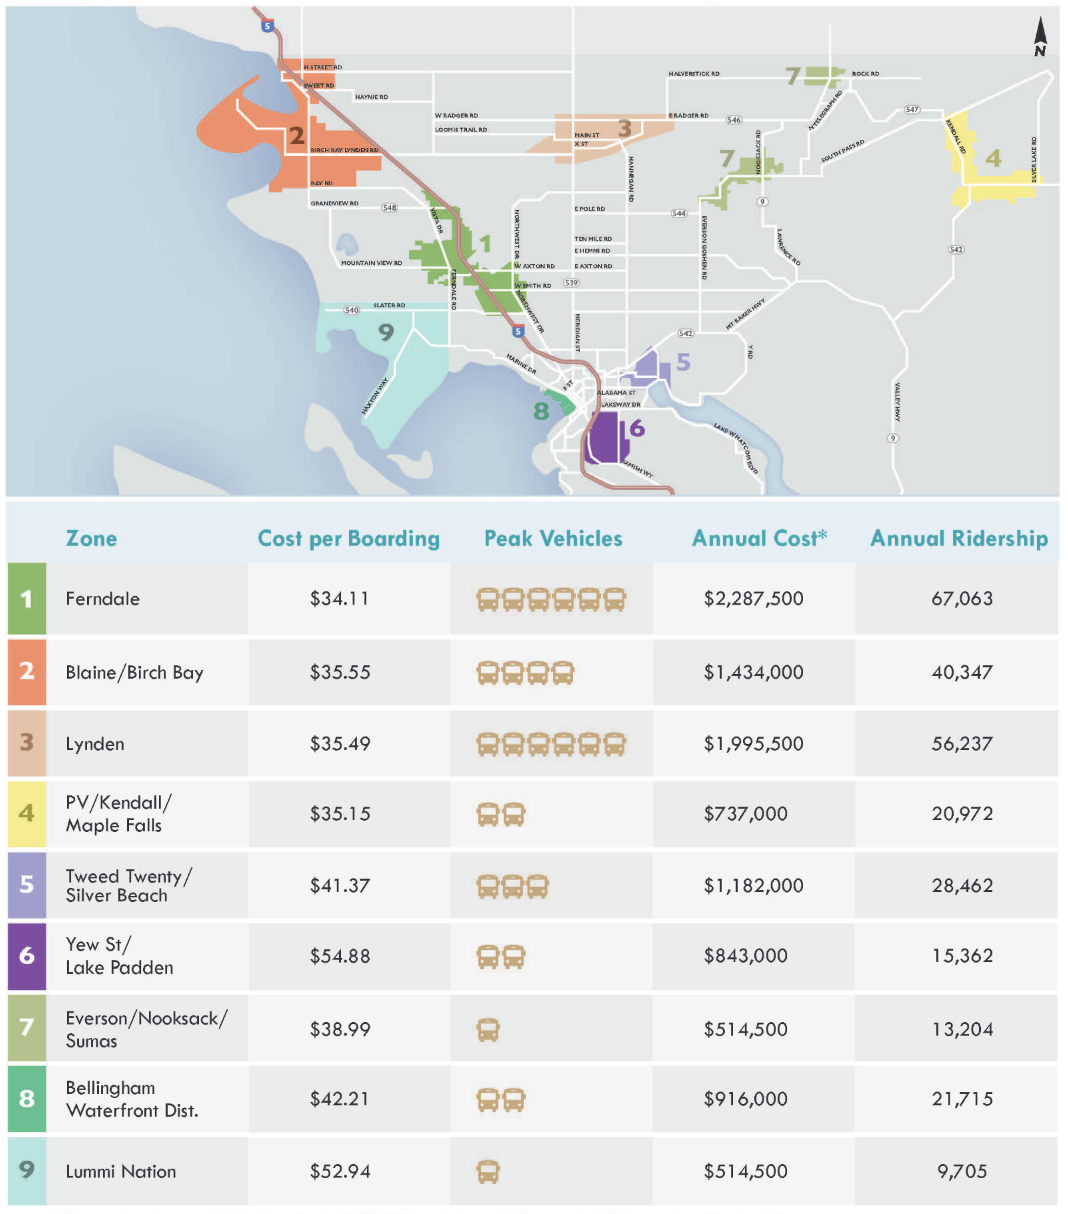
Section from WTA’s 2024 Microtransit Feasibility Study, which shows a map of proposed locations for a future microtransit project and details of examined zones. Credit: WTA
The Lynden Hop also made the trade-offs between fixed route and microtransit service clearer; microtransit can provide convenience and independence, but can also be difficult to scale across multiple cities, especially given WTA’s countywide funding structure. This trade-off between convenience and scalability ultimately shaped WTA’s strategic decision-making; carefully analyzing trip data and rider feedback helped the agency determine that many of the trip purposes could be served through a revised Route 26. In this way, the Lynden Hop left a lasting legacy, despite the service being temporary. WTA learned more about rider behavior and clarified the monetary requirements of microtransit.
Conclusion
The Lynden Hop demonstrated how small agencies can benefit from innovative transit models, while confronting the realities of sustaining these (more expensive) services long-term. By choosing to operate services in-house, WTA gained valuable insight into the realities of microtransit operations, from staff requirements, customer service needs, and the limits of scalability. These insights directly informed the redesign of the bus Route 26, ensuring that fixed-route service in Lynden was more closely aligned with how riders actually traveled.
While the Lynden Hop itself concluded in June of 2024, its impact continues to resonate. The pilot served as a platform for organizational learning, equipping WTA with a deeper understanding of rider behavior in small communities. It also demonstrated that innovation can be a tool for refining long-standing services and grounding future decisions in evidence. Ultimately, the greatest legacy of the Lynden Hop may be how it shaped WTA’s mindset as an agency, as WTA experienced that it can innovate and experience while still upholding its values and maintaining a financially sustainable system. As WTA continues to innovate and evolve, the lessons of the Lynden Hop will remain key for balancing community needs, agency capacity, and long-term system operations.