Successes in Seattle with Transportation Demand Management
20 minutes Date Launched/Enacted: Aug 14, 2017 Date Published: May 30, 2018

Brief Summary
- Seattle’s economy has grown at a considerable rate. Through local and regional transportation demand management efforts, most of the gains in net commute trips were by means other than single-occupancy vehicles.
- Seattle has implemented a range of policies that require employers and other businesses to produce Commute Trip Reduction (CTR) plans, offer transit subsidies to employees, and join Transportation Management Associations (TMAs).
- The ORCA (One Regional Card for All) card was launched in 2009. With this card, commuters could pay for different forms of shared mobility through one account/
- Voters approved the creation of the Seattle Transit Benefit District (STBD) in 2014, which used sales taxes and vehicle registration fees to support transit projects.
- Many different strategies have contributed to Seattle creating a strong TDM effort.
Introduction
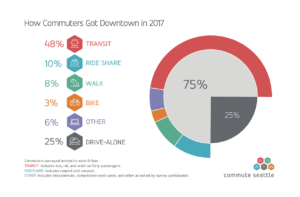
Many jurisdictions have embraced transportation demand management (TDM) programs as a way to reduce vehicle miles traveled (VMT), especially for work trips. Seattle, Washington has been particularly successful with its TDM measures, achieving a 75% non-single occupancy vehicle (SOV) mode share as of 2017 (Fig. 1). All this was accomplished at a time when Seattle was experiencing significant growth in both its population and its central business district (Fig. 2). From 2010 to 2016, downtown Seattle added 45,000 jobs, yet 95% of the gain in net commute trips were by means other than SOVs.[1]
While the city of Seattle’s growth has resulted in a corresponding growth in the volume of SOV commuters and the attendant congestion, there are signs that the region will continue toward greater alternative transportation mode share. Several factors likely contributed to the success of Seattle’s TDM measures, including authority that devolves consistently from state government, robust reporting, and taxpayer support for expanding public transit and alternative transportation through the downtown.
The following analysis explores these factors after a brief overview of the TDM concept.
What is Transportation Demand Management (TDM)?
When faced with peak hour congestion (demand) on their roads, departments of transportation have traditionally increased their supply, i.e. they have added travel lanes or entire roads. A TDM strategy seeks to relieve demand—specifically by single occupancy vehicles (SOV)—through a variety of measures, including improved transit and alternative transportation facilities; incentives for ridesharing, reduced parking, telecommuting, and alternative work schedules; and commuter benefits, such as subsidized transit passes. In addition to traffic congestion, a successful TDM program addresses externalities caused by fossil fuel consumption.[2]
Enabling Policies
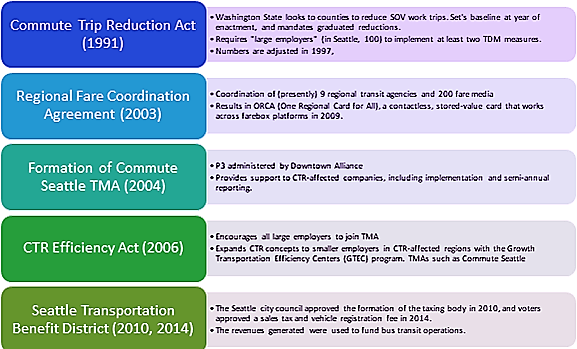
Seattle’s policy framework, outlined in Figure 3, reveals a process that has adapted and expanded over time. Beginning in 1993, Seattle measured a baseline SOV commute mode share by district based on a survey completed the year before, set goals for reduction by percentage in each district (though these would later change), established the threshold for what the city considers a “major employer” (100 employees), and called for those employers to produce a Commute Trip Reduction (CTR) plan to reduce commute trip VMT (Ordinance no. 116657). Among many other requirements, owners or tenants of these large commercial buildings must offer transit pass subsidies of at least 50% for all building employees (Seattle DPD and SDOT, 2015). Companies must also submit to an annual review or join a Transportation Management Association (TMA).
For Seattle, the formation in 2004 of Commute Seattle, a TMA under the direction of the public-private Downtown Transportation Alliance, helped to provide direction for Seattle’s TDM strategy.[3] Commute Seattle applies a strategy to TDM, which they see as the only true way of implementing commute trip reductions. Even more remarkable is that Commute Seattle was formed and achieved its successes during a time when downtown employment was growing, and residential development had taken hold. The growth trends have only accelerated since. The Toward a Sustainable Seattle comprehensive plan of 2005 anticipated this growth, and proposed an “Urban Village” strategy, which encouraged denser and mixed-use development. Washington State’s CTR Efficiency Act of 2006 pushed the large employers towards membership in a TMA, which signals an interest in implementation over enforcement.
Urban Villages and Coordinated Strategies
The year 2008 marked a watershed period in transportation planning for Seattle. The proposed replacement of the Alaskan Way Viaduct prompted a wholesale reevaluation of the transportation program. The Seattle Department of Transportation produced a plan that addressed what it saw as the major issues for the city’s transportation system. In the chapter on Transportation Demand Management, the plan’s authors hint at their approach in the coming years:
It can be difficult to determine exactly what the effectiveness is of any one strategy, and TDM works best when complementary strategies are packaged together (for example, increased bus service combined with subsidized transit passes). However, certain strategies, such as congestion pricing (tolls that vary based on time of day and/or roadway congestion levels), parking management, compact mixed-use development, and provision of high capacity transit service have repeatedly achieved notable success in reducing travel demand and shifting travel away from single-occupant vehicles to more efficient modes.[4]
While congestion pricing plans remain difficult to implement, Seattle has had success with the other measures, thanks to CTR policy.
The 2008 plan also appeared at an important economic moment. The Great Recession was in full swing, gasoline prices were at near record highs, and bus ridership spiked. But Seattle had already bought into the model that service improvements were more important to the users than a calculation of the costs gasoline price versus transit fare in determining sustained mode shift.[5]
Growth, Transit Benefit Districts, and Goals Achieved
Seattle’s maximalist approach of improving bicycle and pedestrian facilities, encouraging parking reform, and, finally, building fixed-guideway transit has positioned the city well for the future. However, the near-term mode shift was largely enabled by efficiencies on the existing system: fare integration and funding and improvements to bus transit service.
The success of the employee transit benefit—for employees, that means that they can load transit fare onto a pass, pre-tax—is itself the product of a complementary strategy. The state legislature realized, contemporaneously with the original CTR legislation in 1991, that it would need to coordinate transit across the region, where there were 200 separate fare media. The resulting Central Puget Sound Regional Fare Coordination (RFC) Project yielded the ORCA (One Regional Card for All) card, which could draw fares from a single account. The actual commitment to the system was signed in 2003, and the beta testing began in 2006.
The ORCA card was launched in 2009, with two levels of transit benefit to employers. The non-retail level, aka “Passport,” allows benefits-eligible employees to use the card for transit, vanpool, and guaranteed-ride-home programs. The retail Business Choice allows businesses to buy cards at retail cost. The two programs quickly accounted for over half of ORCA’s initial adoption.[6]
Despite the adoption of the cards by businesses, the transit system faced challenges, especially in the central business district. The city responded with the creation of the Seattle Transit Benefit District (STBD) in 2010. Seattle voters approved the STBD in 2014. This tax district included the entire municipality and drew its funding from a sales tax and city vehicle registration fee. Seattle used the funds to subsidize bus routes that were in danger of either elimination or reduction of service. As of 2016, the fund administrators claim to have added 270,000 annual service hours, saved 5 routes from elimination, and increased frequency on at least 38 routes, among other service improvements.[7] The increase in unlinked passenger trips on the Metro buses from 2010 (87,470,767) to 2015 (102,302,980) would seem to not only affirm Seattle’s strategy, but run against national trends.[8]
Sustaining, and Reporting, Successes
While it cannot be stated enough that many factors have contributed to the success of Seattle’s TDM program, transit use marks the largest mode shift, both in volume and percentage. The success of the largely bus-driven transit network as enabled by policy and private company buy-in, in the words of another analysis “bode[s] well for the city’s ability to quickly shape and adapt to whatever new transportation technologies take hold.”[9] The enabling policies, funding, and consolidation of transit enabled the ultimate sustainability of Commute Seattle, but they have also seamlessly integrated their semi-annual reporting mandate with their broader marketing efforts. The resulting data enables SDOT and other agencies to set realistic goals.[10]
Moving forward, the planners who administer the CTR programs are looking to expand the lessons learned to non-work trips (fig. 3). They hope to offer competitive grants to communities that implement programs that reduce SOV trips, using TDM measures.[11]
Figure 1: Mode Share, Seattle Central Business District, 2016
Source: Commute Seattle
Figure 2: Seattle TDM Key Policy Timeline
Shared Use Mobility Center. Sources: SDOT, State of Washington, Commute Seattle, and King County
References
[1] From 2010-2013, Seattle saw a 7.2% growth rate.
[2] The non-profit, Washington-based Municipal Research and Services Center hosts a primer on Transportation Demand Management that discusses all aspects of the strategy from a State of Washington perspective. The Victoria Transport Policy Institute also hosts a helpful “Commute Trip Reduction” entry in their TDM Encyclopedia.
[3] See https://commuteseattle.com/articles/how-do-you-commute-downtown/ for additional information on the TMA.
[4] Seattle Department of Transportation. 2008. “Seattle Urban Mobility Plan,” January. Page 7A-2. See also “Urban Mobility Plan”
[5] See Seattle Times http://www.seattletimes.com/seattle-news/riders-pack-buses-in-record-numbers/ and US Department of Energy https://energy.gov/eere/vehicles/fact-915-march-7-2016-average-historical-annual-gasoline-pump-price-1929-2015
[6] Available at King County Metro Transit Increasing Access to ORCA Regional Fare Media. April 2012: http://metro.kingcounty.gov/am/reports/2012/orca/Metro_ORCA_Access_04-12_.pdf
[7] The Seattle Transit Benefit District web page explains https://www.seattle.gov/stbd/. See also: http://sdotblog.seattle.gov/2016/12/08/big-benefits-from-seattles-transportation-benefit-district/
[8] See the National Transit Database Transit Profiles: 2015 Top 50 Summary (pages 11 and 13) and NTD 2010 Table 19: Op-Stats Service.
[9] For an excellent analysis that examines the success of the Seattle TDM with an emphasis on taxation, land use policy, and parking, see Sarah Jo Peterson. 2017. “Seattle’s Transportation Transportation.” Urban Land.
[10] See “Seattle Employer Transportation Benefits Survey Results Report: March 2016” for the depth or reporting.
[11] Washington State Commute Trip Reduction Board. “2015 Report to the Legislature.”

