Project Goals:
Defining the goals and objectives is a critical step in the early phases of a project. It is common for a project to have many goals depending on the scope of the work. To identify the project goals, we first need to think about what type of project it is. The type of project will inform the goals and objectives and the subsequent data required to measure it. Below are a couple of considerations for goal setting.
Needs Assessment: A needs assessment is a process that includes a projects’ key stakeholders and the community to identify what the needs of the community are to best determine the project’s direction and goals. This step is necessary for new projects to understand what products and services will be useful to the community and help shape the work scope. To get a clear picture of the project area, we need to set a geographic profile that provides demographic information of the community and a baseline of its mobility, including variables such as accessibility, reliability, or affordability. The Clean Mobility Options Needs Assessment Data Collection Guide offers specific data sources to create accessibility, reliability, and affordability-based mobility baseline. The results of the needs assessment should directly inform a projects’ goals.
Goals setting criteria: Goals can vary in terms of their specificity. It may make sense for a project to have overarching, long-term goals while also creating more detailed, interim, or sub-objective goals to serve as checkpoints for the larger ones. SMART goals are common goal-setting criteria that are specific, measurable, attainable, relevant, and time-based.
Next Subsection
Performance Metrics, Data Type
Establishing performance metrics associated with the project goals involves thinking through the projects’ desired outcomes and impact and identifying the appropriate data or information to measure those criteria. Following are some considerations to think through when developing performance metrics.
Data required: The data required to evaluate and measure a goal should be identified when establishing goals. Access to data should not necessarily deter from striving for that goal. However, it is helpful to set expectations early and understand if more innovative solutions to measure the outcomes are necessary. Valuable questions to think about when identifying the data required are: What do you need to learn? What types of analysis are required and why? What types of data would be needed? SUMC’s White Paper, Objective-Driven Data Sharing for Transit Agencies in Mobility Partnerships, can guide the importance of defining the data required early in a project to ensure that these are negotiated in the data-sharing agreement between the agency and private operator.
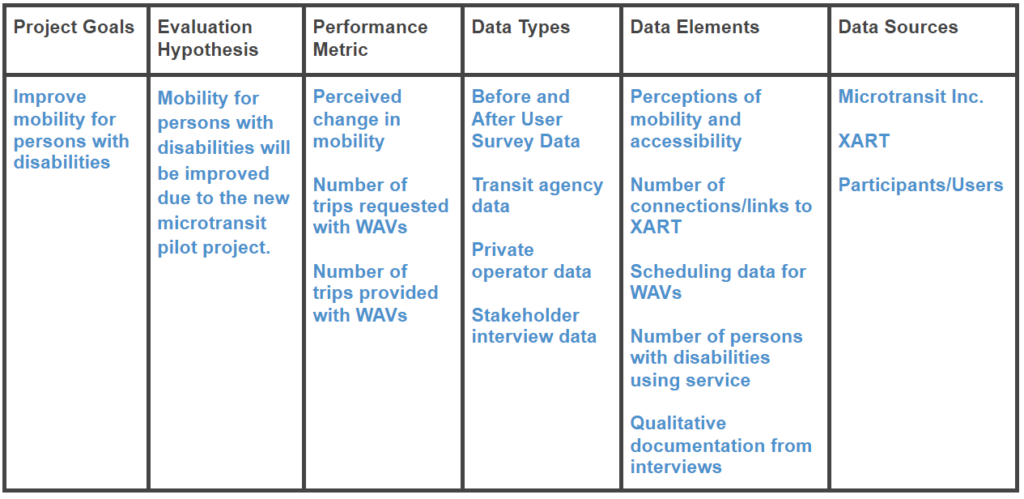
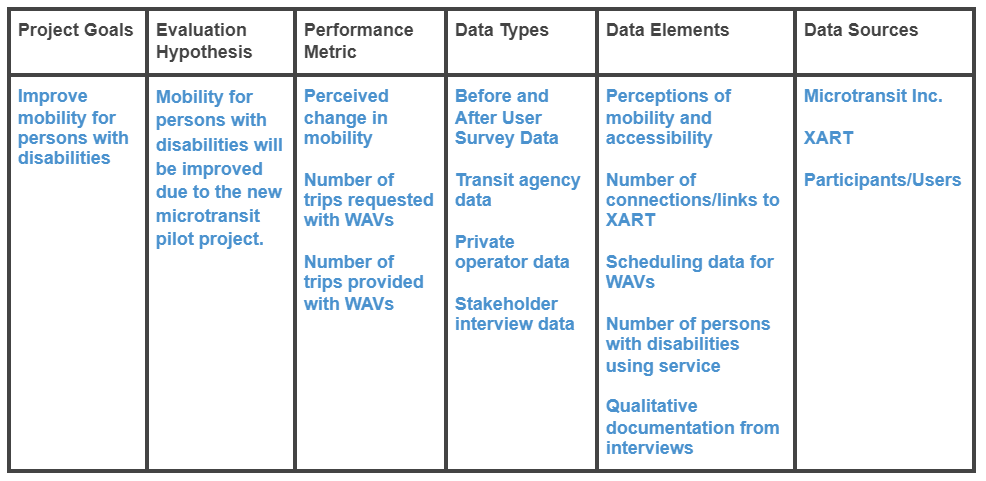
Qualitative or quantitative data: Qualitative and quantitative data are important information to include in performance metrics. They complement each other and can both offer powerful insights. An example of qualitative data could be the information gathered from stakeholder interviews, and a quantitative data example could be the number of transit trips taken.
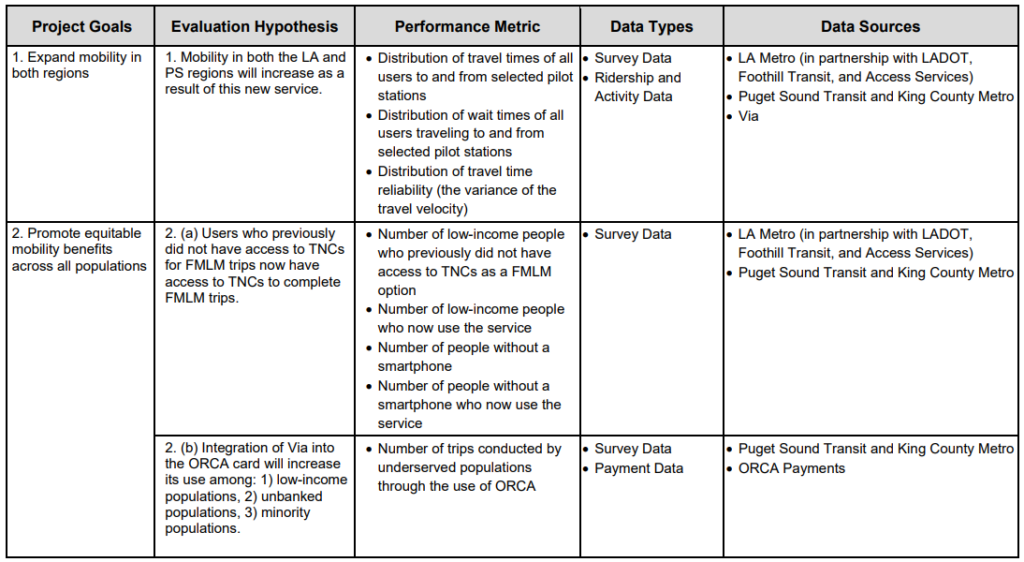
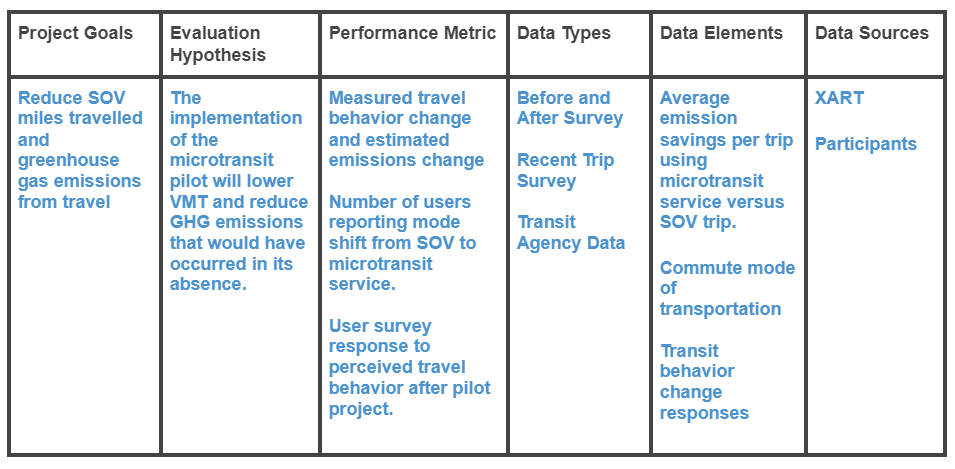
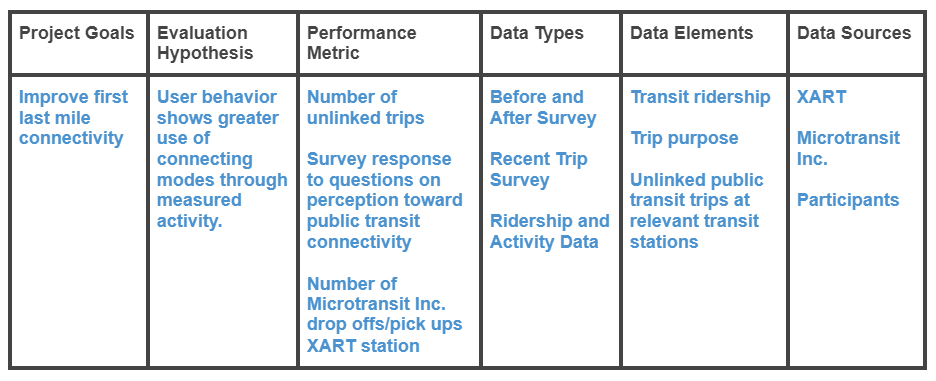
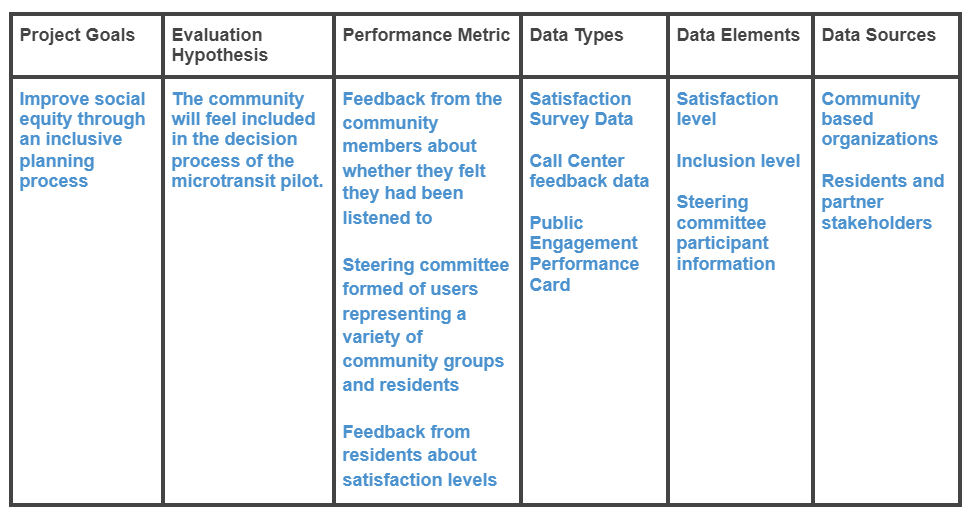
Common Data Types: Examples include survey data, ridership and activity data, payment data, fuel usage data, crime statistics data, or stakeholder interview data. Survey data can come from ‘Before and After Surveys’ or ‘Recent Trip Surveys.’
Common Data Sources: Key stakeholders such as a private operator, local transit agency, the payment company, the local metropolitan planning organization (MPO) and/or Council of Governments, or surveys/on the ground observations are common data sources.
Data dependencies and interdependencies: This is the concept that there may be multiple performance metrics for one goal, or conversely, one performance metric may meet more than one goal. Data dependencies and interdependencies help prioritize what data is most important to collect. Data with higher counts of dependent metrics are the most important to collect as they inform the most significant metrics.
Feasibility Analysis: A data feasibility analysis can help identify how complex the data will attain with ratings ranging from high to infeasible.
- High feasibility. Indicates that the data are currently measured by a stakeholder/entity
- Moderate feasibility. It means that external data currently measure the data
- Low feasibility. It denotes that the data are currently not measurable but would be measurable in the future with insignificant to moderate additional effort
- Infeasible. This indicates that the data is currently not measurable and would be measurable in the future with the significant extra effort that would require policy and/or regulatory actions. For additional performance metrics, visit FTA’s document Mobility Performance Metrics (MPM) for Integrated Mobility and Beyond.
Questions used in a feasibility analysis include:
- Does the data exist?
- Are the data available?
- What is the feasibility of obtaining the data?
- What are the constraints and the level of those constraints associated with available data?
- What would be the format and unit of a given data element?
- What data sets are currently unavailable but in development phases by the agencies or stakeholders?
- What are the data that are not available?
Data Collection Period: This involves the timing and frequency of the data required. Common project data needs include those described below.
- Transportation Trends: Archived, Post-Processed Data
- Service Planning: Archived, Post-Processed Data
- Service Delivery, Effectiveness, Accountability: Trip Data involving, operations data (Pickup and drop-off times, wait times, travel times, etc.), accounting data, and auditing data
- Integrated Trip-Planning and Payment: Real-Time Data
Data Standards: As the technical capability of public agencies and mobility providers continues to improve, data specifications are becoming more popular as a way to more easily accelerate mobility partnerships across many types of agencies and cities. While specifications such as GTFS, GBFS, and TDS have transformed how transit and micromobility services communicate on the back end to more easily enable trip planning/Mobility as a Service(MaaS) tools for travelers, they do not directly address how data about trips or rides should be collected to measure the success of mobility projects. One way to collect data about micromobility trips, in particular, is the Mobility Data Specification (MDS). However, MDS is intended more as a regulatory tool and may not be appropriate for your project, especially since the specification requires very granular data collection that may not suit your specific project or your agency’s technical capacity. More generally, SAE has developed standards defining automation levels and taxonomy for micromobility technology and shared mobility services that help agencies communicate the intent or scope of their service more clearly.
Establishing data sharing agreements: Despite advances in data availability, the private operator may be reluctant to share for proprietary and confidentiality reasons. If the project goal requires specific data, it is crucial to explain their value and how they will be used to meet a project’s goal. Data sharing agreements are helpful in these situations to articulate what information is needed and its intended use. As mentioned above, best practices for transit agencies can be found in SUMC’s White Paper, Objective-Driven Data Sharing for Transit Agencies in Mobility Partnerships.
Data Risk Management: This is associated with the data collection process. For example, when using survey data as the survey type for a performance metric, there is a risk that a low survey response rate does not lead to statistically significant results. Some of the main risks include maintaining the data schedule, performing data quality assurance spot checks, data sufficiency, and discussed below, data anonymity.
Data Protection Plan: Whether the source is a partner or a third party, the data must be handled and stored appropriately. The primary concern on all sides is data management and security. This could affect collection, formatting, storage, archiving, access/authorization protocols, cybersecurity, reporting (internal and external), and compatibility with existing systems. Data handling and security protocols must be discussed thoroughly before forming partnerships and clearly defined in agreements while adhering to the regulations regarding data and privacy at the local, state, and federal levels.
Previous Subsection Next Subsection
Reporting
How and when a project disseminates its results and findings to its constituents can be a critical component to retaining funding and showing the value of the implementation.
Frequency of Reporting: Analyzing and reporting should be an ongoing procedure to keep key stakeholders engaged and aware of progress and ensure the initial results are tracking to anticipated goals. The frequency can vary from project to project, but it is common to report back to a funder monthly or quarterly. With this in mind, it is essential to consider a concise format to track and report out on key elements. For example, projects focused on community engagement may create a survey to give to their steering committee every month, including a few of the questions and answers pulled into a monthly report. The final report is equally important for any pilot project, including an executive summary and details of the demonstration, evaluation hypotheses, data collected, analysis performed, findings, and results. The report can also utilize a mix of exhibits, including tables, graphs, and charts.
Distribution of Reporting: Common recipients of shared mobility project reports include the funder of the pilot project, such as the Federal Transit Administration, the Board members of the organization, if applicable, key partners, and the community. Reporting to the community is an important component of all projects but specifically for those who have held community engagement activities during the planning and implementation phases. This process can help build trust between the community and the project provider, showing the community the results and impact of their efforts.
- Example evaluation reports:

Previous Subsection