Partnership Configurations
Because microtransit services often resemble existing demand-responsive transportation (DRT) or supplement fixed-route service, they can be operated in a wide variety of partnership configurations. Different types of partnerships reflect the capital and operational needs of the partnering agency. A microtransit service provider can partner with a city or transit agency to provide any or all of the technology, vehicles, drivers, maintenance, and other operations, according to the specific needs of the agency:
- The private partner typically provides the routing and dispatching platform across all these partnership configurations.
- The private partner may assist with funding the mobility service through brand recognition and advertisement. For more information, visit SUMC’s Mobility Funding Strategies Learning Module.
- Private sector technology; public agency vehicles and drivers. An agency deploys the private partner’s dispatch, routing, and/or user app technology on agency-owned and operated vehicles. The AC Transit Flex program used this model.
- Private sector technology; public agency vehicles; non-profit agency drivers. This arrangement is more common in human services transportation.
- Private sector technology and drivers; public agency vehicles. A transit agency will provide the vehicles, while a private partner handles the other aspects of the service. The MetroFlex project in King County, WA is an example of this type of partnership configuration.
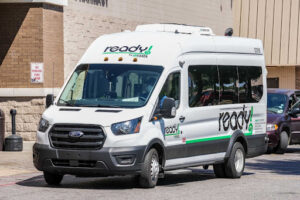
- Turnkey solution. A private operator (or a consortium) provides the entire microtransit transportation service for an agency, including technology, vehicles, and drivers. This type of partnership is common for agencies or jurisdictions that do not already have their own vehicles or operational framework to provide microtransit. Arlington On-Demand, Arlington, TX’s microtransit service is an example of this type of public-private partnership.
When developing and launching a successful microtransit program, it is crucial to identify a private partner whose goals and vision align with those of both the community and the microtransit initative. Having an aligned vision ensures that the partnership supports microtransit objectives. Ultimately, a partner that is a good fit for the microtransit initiative can ensure that it becomes a vital and well-integrated part of the community’s transportation options.
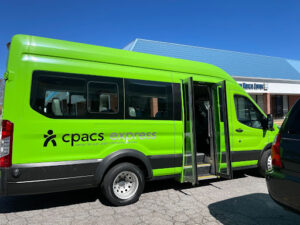
Image of CPACS’ Ride’s Shuttle. Credit: CPACS
Next Subsection
Types of Service
Microtransit services broadly share the following characteristics:
- Allow riders to request trips on demand, rather than hours or days beforehand (although advance or scheduled reservations are possible)
- Allow for electronic payments
- Allow passengers to manage personal info and payment methods, request rides, and provide feedback.
- Provide real-time information related to vehicle location before and during the trip
- Operate within a certain coverage area, or service area is the geography within which a service operates.
- Follow the regulations of the US Department of Transportation and the Americans with Disabilities Act. For more information, see the Federal Transit Administration’s host page Shared Mobility FAQs: Americans with Disabilities Act (ADA).
Following are some of the more typical microtransit operational approaches. There is not a one-size fits all and agencies can use and adapt these approaches to best meet the specific needs of their communities.
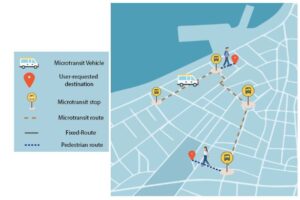
Flex-route within a zone (also referred to as Point-to-Point service): Similar to a ridesharing service, the route is determined by riders’ origins and destinations within a predetermined zone, most commonly used in denser areas. The routing and dispatching software plans a route that accommodates multiple origins and destinations and riders are picked up and dropped off at those origin and destination sites. The green area in the graphic below shows the service area zone, with a microtransit van picking up passengers and dropping them off at their destinations.

Deviated Fixed-Route: This type of microtransit service is often used in lower-density communities, where microtransit vehicles might travel along a fixed route, but have the flexibility to deviate from that route for pick-up and drop-offs. This type of service can be helpful in lower-density areas, as the service can switch to flex-route service, as depicted in the graphic below.

First and Last Mile Service: Regardless of a city’s amenities or density, first and last mile services fill the gap between passengers’ starting or ending locations and public transportation. First and last mile service is especially important in small-urban and less-dense communities as the distance to public transportation can be lengthy compared to their higher-density urban counterparts, which are often closer to fixed-route public transportation. The graphic below shows fixed-route transit traveling from an urban core to a bus terminal, where microtransit service is available to take passengers to their destinations.

Hub and Spoke Model: This hybrid service model combines the benefits of point-to-point and first and last mile models to assist passengers with shorter trips. This model consists of several popular destinations that act as a terminal, with drivers picking up or dropping off passengers from that point within a zone. Terminals often include grocery stores, medical facilities, libraries, or downtown centers. The microtransit vehicle can make other stops along the way but the designated terminal points are given scheduling priority, making this type of microtransit useful in small towns, or denser communities. The graphic below shows how the hub and spoke routes could look as the microtransit vehicle serves either a designated zone or provides service across zones.

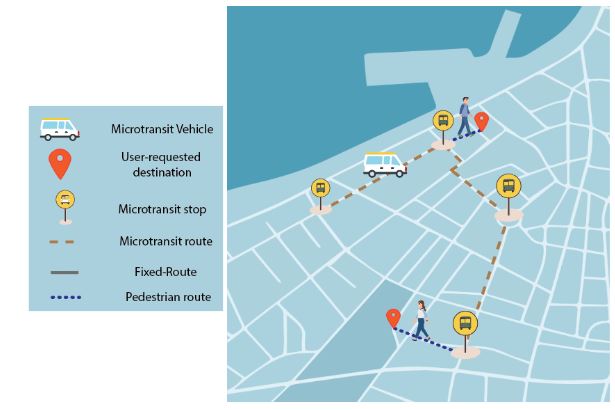
Virtual stops (also referred to as corner-to-corner service): This type of microtransit, typically used in more dense areas, uses routing and dispatching software to alert the microtransit operator to create an efficient route to multiple destinations, in which the operator may (through a location-enabled mobile app) direct users to set pick-up and drop-off locations within a reasonably walkable distance of origins and destinations. This allows for passenger grouping to reduce stops and increase vehicle utilization. The following graphic helps to visualize how virtual stops work, with riders being dropped off at various stops and walking to their final destination.
Within these service models, microtransit operators can customize how passengers are picked up and dropped off:
- Curb-to-Curb: In a curb-to-curb service model, a vehicle will arrive at the trip origin and end at the requested destination within the right of way, distinguishing it from door-to-door service more common with human service transportation providers and associated with TNCs like Uber and Lyft.
- Door-to-Door: Some microtransit services offer door-to-door service where the vehicle will pick up and drop off riders at the curb of their origin and destination sites.

The above graphics help to illustrate the difference between the two microtransit models. The graphic on the left shows curb-to-curb service, while the right shows door-to-door service. Curb-to-curb service passengers are directed to walk to a specific pick-up site and are similarly dropped off a short distance from their destination. Door-to-door service passengers are picked up and dropped off at their origin and destination sites.
Previous Subsection Next Subsection
Microtransit Vehicle Examples
Microtransit services can operate with a variety of vehicles to suit the specific needs of a community or region. In a more dense community, a vehicle with a lower capacity may be a better fit, while in a more sparse community, a high-capacity vehicle may be a better fit. Some of the vehicle types used by microtransit operators are:
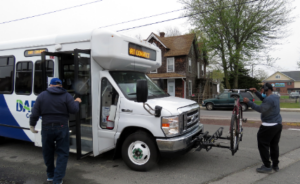
- Cutaway bus or van: In these heavy-duty shuttle vehicles, a van cab and chassis remain, while the remainder of the body is modified for transit use, with a capacity for upwards of 20 passengers. Often used for ADA paratransit and human services transportation, these vans can be re-branded to use as microtransit with little modification.
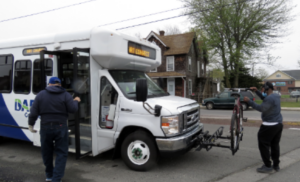
A DART Connect cutaway bus. Credit: Delaware Transit Corporation
- Passenger vans: These tend to be the larger-height vans popularized in Europe, with capacities of 10-15 passengers. The vans can be modified to include wheelchair lifts.
- Minivan: These vehicles typically hold 4-6 passengers, or if the vehicles are wheelchair-accessible, a single passenger using a wheelchair plus one non-wheelchair-using passenger.
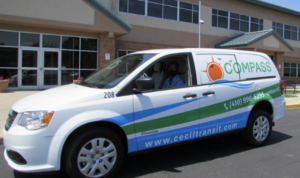
A Cecil County COMPASS van. Credit: Cecil County
Previous Subsection Next Subsection
Data Standards
Public Transit Data Standards play an important role in the operations and rider experience of transportation services, as they support a range of functions from the discovery of services, operations, planning, scheduling, and payment. Specific to microtransit, GTFS-Flex is particularly important because it allows the rider to discover the availability of Demand Responsive Transportation (DRT) services that would not otherwise be readily available. Through this standardization, trip planners like Apple or Google Maps are able to display the zone-based microtransit service – making it possible for riders to discover DRT services that were otherwise unavailable through these applications. Using both GTFS-Flex and its parent data standard, GTFS–which makes available fixed-route transit information–users can discover the range of available public transportation services available to them.
GTFS-Flex requires planning and resources to implement and maintain, which should be accounted for in the project budget.
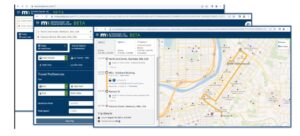
The Minnesota Department of Transportation (MnDOT) offers an example of a State DOT working with small-urban and rural transit agencies to develop a regional Mobility as a Service (MaaS) platform. The platform uses data standards to communicate a range of services including fixed – and flex-route transit, microtransit, paratransit, and human services transportation. The MaaS platform also uses the transactional data specification (TDS) to communicate trip scheduling across transit agencies and mobility providers.
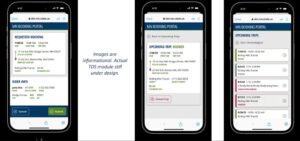
Screenshots of MnDOT’s Regional MaaS platform using GTFS-Flex. Note: Images are informational. Actual TDS module still under design. Credit: MnDOT
Additional data standards are available and when fully implemented can help avoid vendor lock as the common data language used to communicate transportation services is not tied to a single proprietary platform. Data standards also help support a service’s ability to scale and serve new areas, as the framework for communicating transportation services uses a common data language. While still in its early stages, a handful of DRT services are using transactional data specifications to communicate the scheduling of DRT services across mobility providers and jurisdictional boundaries (including the MnDOT MaaS platform discussed above). For more information on transactional data specifications, see Modernizing Demand-Responsive Transportation for the Age of New Mobility (aarp.org).
Screenshots of MnDOT’s web-based trip planner using GTFS-Flex. Credit: MnDOT
Additional GTFS-Flex resources can be found: MobilityData, GTFS-Flex is Officially Adopted: Everything You Need To Know, and the Rural Transit Assistance Program GTFS Builder.
Additional data standards are available and when fully implemented can help avoid vendor lock as the common data language used to communicate transportation services is not tied to a single proprietary platform. Data standards also help support a service’s ability to scale and serve new areas, as the framework for communicating transportation services uses a common data language. While still in its early stages, a handful of DRT services are using transactional data specifications to communicate the scheduling of DRT services across mobility providers and jurisdictional boundaries (including the MnDOT MaaS platform discussed above). For more information on transactional data specifications, see Modernizing Demand-Responsive Transportation for the Age of New Mobility (aarp.org).
Previous Subsection